DOCKER ELK : ELASTICSEARCH, LOGSTASH, AND KIBANA 2020
Note: though still valid, this page is out of date.
So, for the latest Elastic stack, please check out
Docker - ELK 7.6 : Logstash on Centos 7
or
Docker - ELK 7.6 : Elastic Stack with Docker Compose.
There are couple of ways to install the ELK stack with Docker. We can either pull ELK's individual images and run the containers separately or use Docker Compose to build the images and run the containers.
In this post, we'll run docker-compose.
Let's get the source (v6.5.1) from docker-elk.
First, clone the repo:
$ git clone https://github.com/Einsteinish/docker-elk.git
Then, run "docker-compose":
$ cd docker-elk

$ docker-compose up
$ docker ps
CONTAINER ID        IMAGE                      COMMAND                  CREATED             STATUS              PORTS                                            NAMES
8725fe1f9573        docker-elk_kibana          "/usr/local/bin/kiba…"   24 minutes ago      Up 24 minutes       0.0.0.0:5601->5601/tcp                           docker-elk_kibana_1
70f32a7e1c13        docker-elk_logstash        "/usr/local/bin/dock…"   24 minutes ago      Up 24 minutes       5044/tcp, 0.0.0.0:5000->5000/tcp, 9600/tcp       docker-elk_logstash_1
01a2ef381ad6        docker-elk_elasticsearch   "/usr/local/bin/dock…"   24 minutes ago      Up 24 minutes       0.0.0.0:9200->9200/tcp, 0.0.0.0:9300->9300/tcp   docker-elk_elasticsearch_1
$ lsof -PiTCP -sTCP:LISTEN
COMMAND     PID        USER   FD   TYPE             DEVICE SIZE/OFF NODE NAME
...
com.docke  6330 kihyuckhong   18u  IPv4 0x38d0f1345a99050d      0t0  TCP *:9300 (LISTEN)
com.docke  6330 kihyuckhong   21u  IPv6 0x38d0f1344efc8805      0t0  TCP localhost:9300 (LISTEN)
com.docke  6330 kihyuckhong   22u  IPv4 0x38d0f1345a33abad      0t0  TCP *:9200 (LISTEN)
com.docke  6330 kihyuckhong   23u  IPv6 0x38d0f1344efcc185      0t0  TCP localhost:9200 (LISTEN)
com.docke  6330 kihyuckhong   24u  IPv4 0x38d0f1345de7312d      0t0  TCP *:5000 (LISTEN)
com.docke  6330 kihyuckhong   25u  IPv6 0x38d0f1344efcbbc5      0t0  TCP localhost:5000 (LISTEN)
com.docke  6330 kihyuckhong   26u  IPv4 0x38d0f1345eebbe6d      0t0  TCP *:5601 (LISTEN)
...
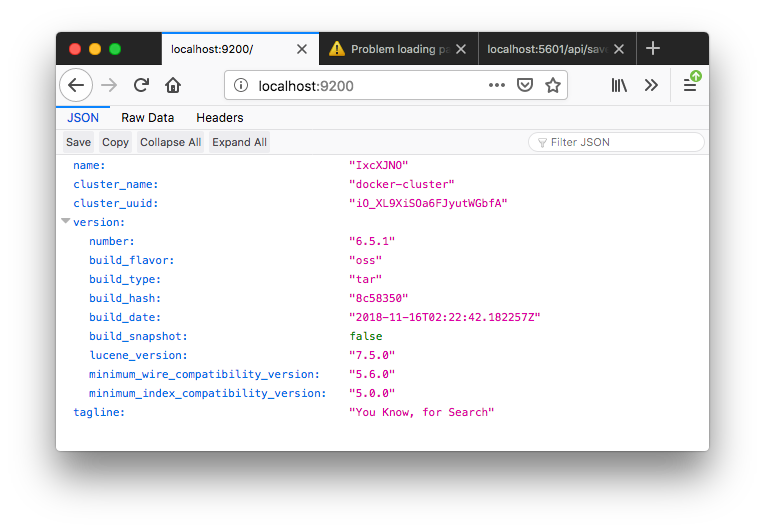
By default, the stack exposes the following ports:
- 5000: Logstash will listen for any TCP input on port 5000
- 9200: Elasticsearch for HTTP REST API
- 9300: Elasticsearch TCP nodes communication
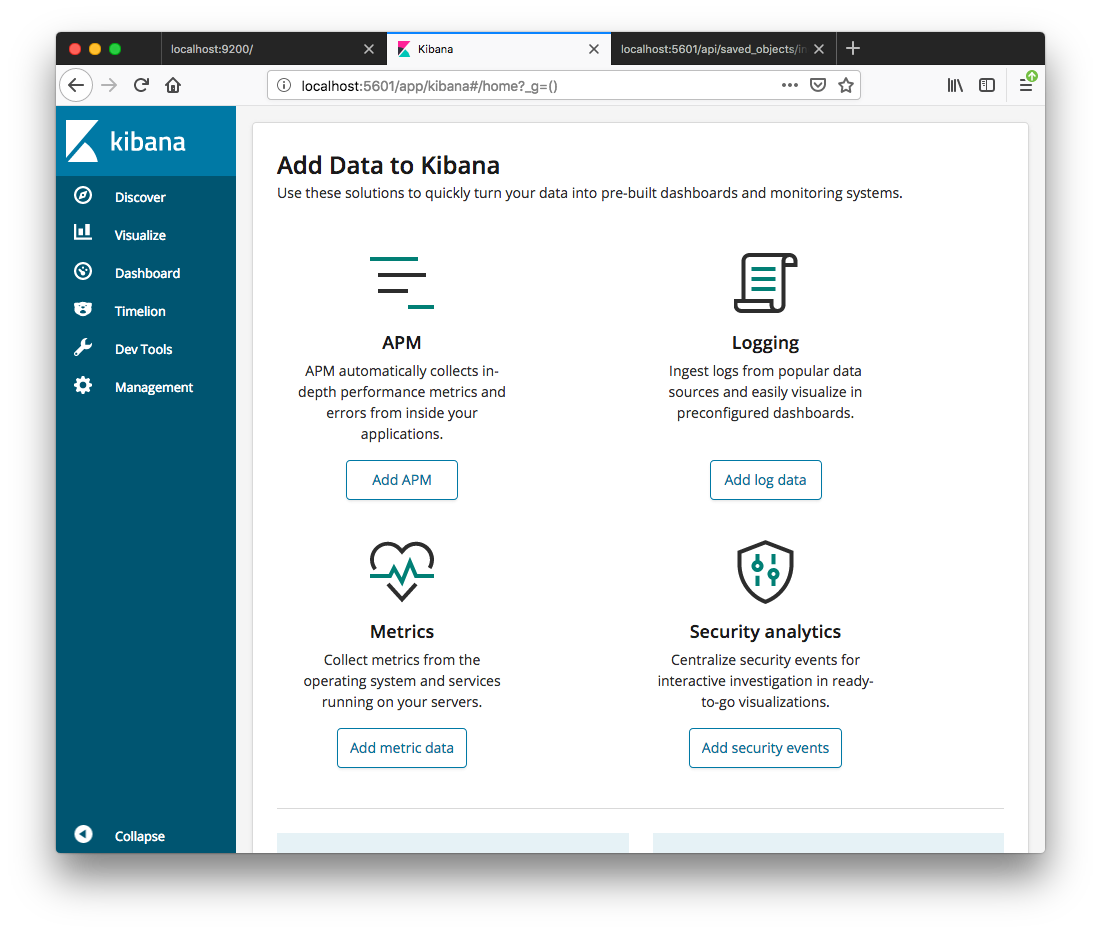
- 5601: Kibana web UI


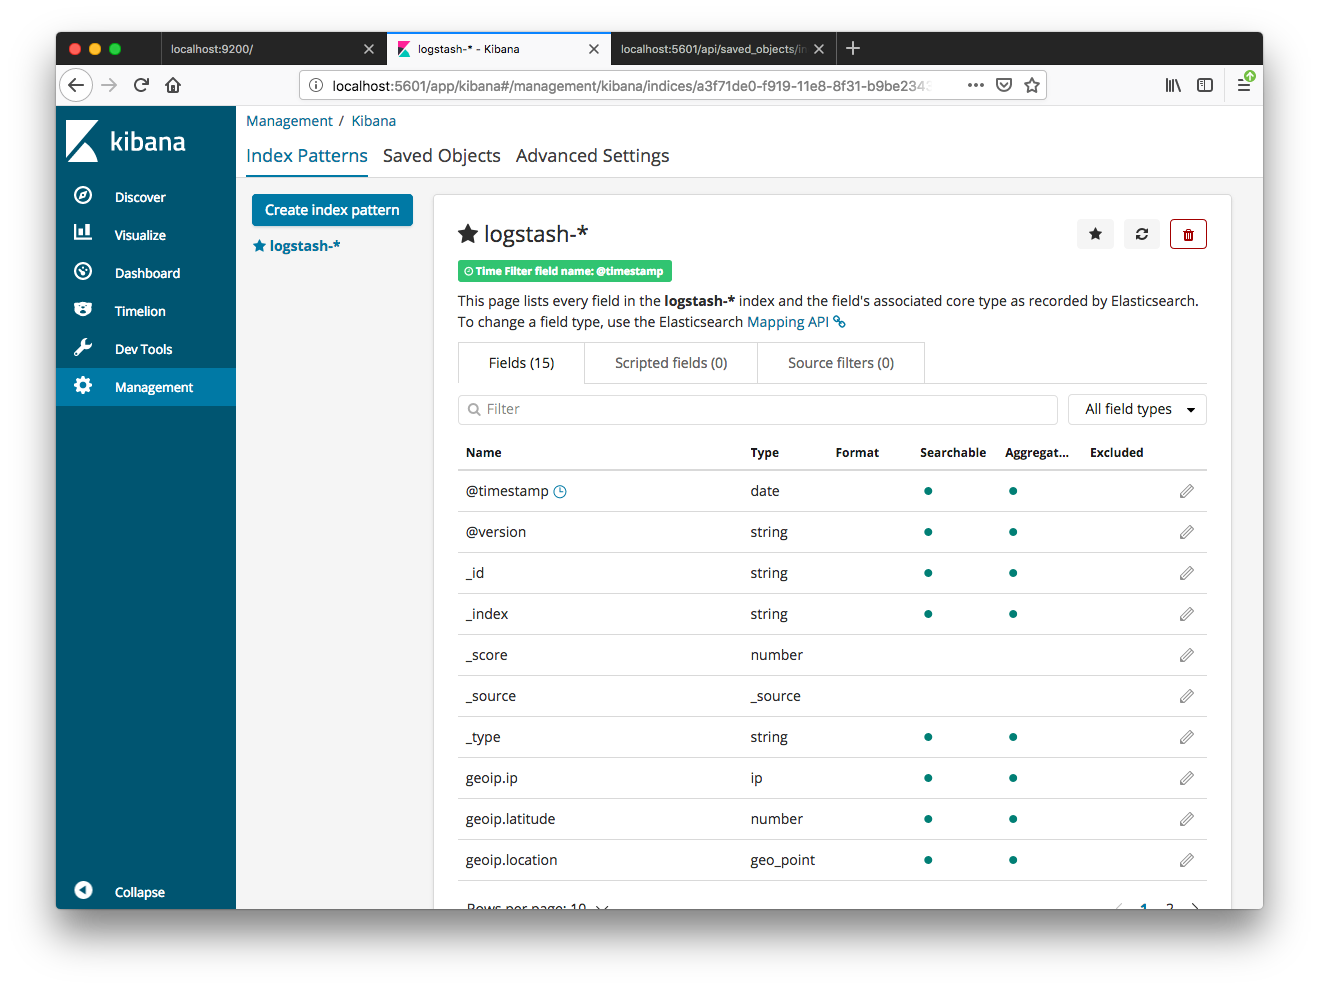
Kibana has its own API for saved objects, including Index Patterns. The following examples are for an Index Pattern with an ID of logstash-*.
$ curl -XPOST -D- 'http://localhost:5601/api/saved_objects/index-pattern' \
 -H 'Content-Type: application/json' \
 -H 'kbn-version: 6.5.1' \
 -d '{"attributes":{"title":"logstash-*","timeFieldName":"@timestamp"}}'
HTTP/1.1 200 OK
kbn-name: kibana
content-type: application/json; charset=utf-8
cache-control: no-cache
content-length: 185
connection: close
Date: Thu, 06 Dec 2018 05:41:55 GMT

{"type":"index-pattern","id":"a3f71de0-f919-11e8-8f31-b9be2343e938","attributes":{"title":"logstash-*","timeFieldName":"@timestamp"},"updated_at":"2018-12-06T05:41:55.517Z","version":1}

Let's get a sample log file (logs.jsonl.gz) from Kibana User Guide [6.5] => Getting Started => Building your own dashboard => Loading sample data.
Now we can send our Log file through nc command directly to ElasticSearch:
$ gunzip logs.jsonl.gz

$ cat logs.jsonl | nc localhost 5000
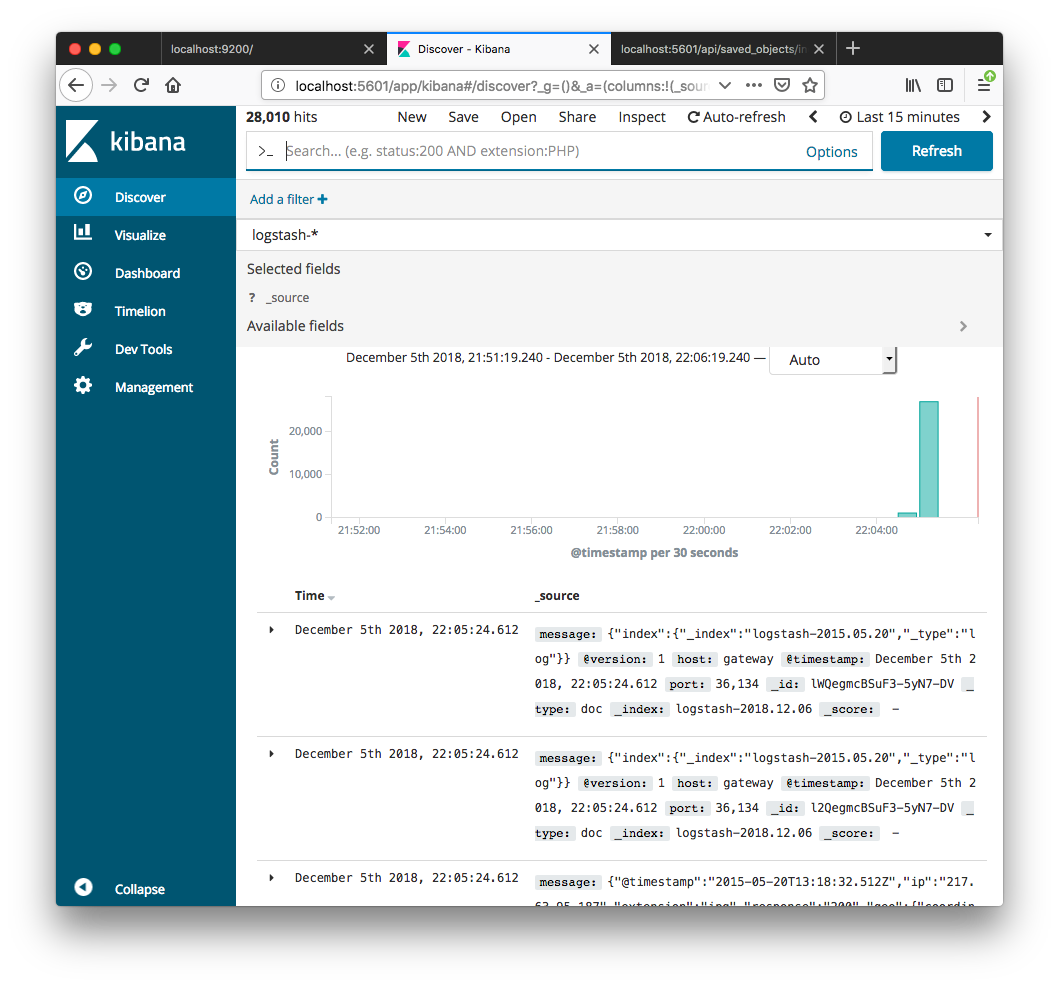
Now we can see the logs hitting on Kibana:

Tidak ada komentar:
Posting Komentar