https://community.veeam.com/blogs-and-podcasts-57/grafana-dashboard-for-veeam-backup-replication-4923
Greetings, friends! I want to share with you the new Grafana Dashboard for Veeam Backup & Replication, no Enterprise Manager is needed, and it uses 100% VBR API.
Small note: For those familiar with the data protection scene, you might recall that we’ve already got a Grafana Dashboard dedicated to the Veeam Enterprise Manager API since 2020.
Grafana Dashboard for Veeam Backup & Replication API
When you finish this article, if you follow all the steps, you should have something similar to this. It might be different according to your environment, number of days you select, protected workloads, jobs, etc.

Dashboard – Summary
- Job Historical Information – The very first graph. The most important one in my opinion. Grouped by 24 hours, get to know the status of your policies per day, on a range in time.
- Job Historical Information Table – Very similar to the previous panel, but this time with more details about job name, status, date, etc.
- Job Historical Information Duration – Very similar to previous panels, but this time showing in a bubble way, how much every job has taken to execute. A very cool way to see what jobs are taking the longer, trends, etc.
- Job Last Result – BIG COLORED PANELS, what everyone I talk about is asking for. Get to know the last status across all jobs, and focus only on the ones are yellow/red.
- Infrastructure – A few tables that shows some Infrastructure data across the Veeam Backup & Replication. A lot to improve here, but so far the VBR API doesn't give us much more details.
- Restore Points – More big panels in colors. The more points, the darker the green becomes. This is a list of all your workloads, or the selected workload on top, with the amount of restore points to date.
Topology with all logical components
Very simple way of working, we will use a bash shell script that connects to our Veeam Backup & Replication Servers, using the REST API, and then it will send the metrics to InfluxDB, and visualize them with Grafana. The design would be something similar to this:

Download and configure the veeam_backup_and_replication.sh script
We have almost everything ready, we have one last step, the script that will make all this work, we will download the latest version from the Github repository:
You will need jq, so please go ahead and install it first (apt-get install jq, or yum install jq)
This shell script can be downloaded and run from the telegraf server, InfluxDB, or any other Linux. We will have to edit the configuration parameters:
##
# Configurations
##
# Endpoint URL for InfluxDB
veeamInfluxDBURL="http://YOURINFLUXSERVERIP" #Your InfluxDB Server, http://FQDN or https://FQDN if using SSL
veeamInfluxDBPort="8086" #Default Port
veeamInfluxDBBucket="veeam" # InfluxDB bucket name (not ID)
veeamInfluxDBToken="TOKEN" # InfluxDB access token with read/write privileges for the bucket
veeamInfluxDBOrg="ORG NAME" # InfluxDB organisation name (not ID)

# Endpoint URL for login action
veeamJobSessions="1000"
veeamUsername="YOURVBRUSER"
veeamPassword="YOURVBRPASSWORD"
veeamBackupServer="YOURVBRAPIPORT"
veeamBackupPort="9419" #Default Port
Once the changes are done, make the script executable with chmod:
chmod +x veeam_backup_and_replication.shThe output of the command should be something like the next, without errors:
Writing veeam_vbr_info to InfluxDB
Writing veeam_vbr_sessions to InfluxDB
Writing veeam_vbr_sessions to InfluxDB
Writing veeam_vbr_sessions to InfluxDB
Writing veeam_vbr_sessions to InfluxDB
Writing veeam_vbr_sessions to InfluxDB
If so, please now add this script to your crontab, like for example every 30 minutes:
*/30 * * * * /home/oper/veeam_backup_and_replication.sh >> /var/log/veeam_backup_and_replication.log 2>&1Grafana Dashboards
I have already spend the time building all the queries, variables etc for you. Just go to Grafana and download it, or use the ID:
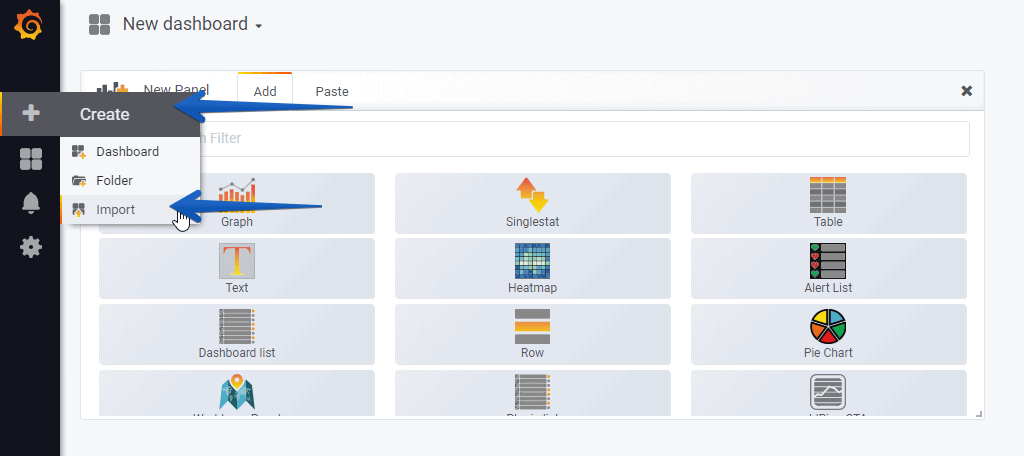
Import Grafana Dashboards easily
Knowing the Grafana dashboard ID, we can just import it:18854:
 And that’s it. With the menus on the top you can display and adjust the Dashboard to your different choices, like jobs, workloads, etc.:

Please leave your feedback in the comments, or on GitHub.
Tidak ada komentar:
Posting Komentar